
Table of Contents
ToggleInterpolation of contours refers to the process of proportionately drawing contour lines between plotted ground points or between existing contour lines. This technique assumes that the slope of the terrain between any two points is consistent and can be carried out using several methods:
- Estimation
- Arithmetical Calculation
- Graphical Method
1. Estimation Method
In this approach, the locations of contour points between known ground points are approximated, and contour lines are drawn based on these estimates. While this method is relatively simple, the level of accuracy depends heavily on the expertise and judgment of the surveyor. It is often employed for creating contour maps on smaller scales. For example, the Survey of India typically relies on this method for generating topographical maps at a scale of 1:50,000.
Procedure of Estimation Method
The heights of selected ground points are determined by taking clinometric readings and multiplying them by the scaled distances from the plane table position. These points are then surveyed using standard plane table methods. Contours are interpolated between these points, taking into account the natural features of the terrain. With an experienced surveyor, this method can yield reliable contours with minimal errors.
2. Arithmetical Calculation Method
In this method, contour positions between two known points are determined through precise calculations. While this approach provides a high degree of accuracy, it can be labor-intensive and time-consuming. It is often employed when precision is paramount in a limited area.
For example, consider four points, A, B, C, and D, which are spaced 2 cm apart, with their respective ground elevations being 57.5 m, 63.2 m, 68.2 m, and 59.2 m. The task is to draw contour lines at 2 m vertical intervals between these points.
(a) Interpolation Along AD
The total elevation difference between points A and D is:
59.2 – 57.5 = 1.7 m
The difference in elevation between point A and the 58 m contour is:
58.0 – 57.5 = 0.5 m
Thus, the distance of the 58 m contour from point A is calculated as:
(0.5 / 1.7) × 2 cm = 5.9 mm
(b) Interpolation Along AB
The total elevation difference between points A and B is:
63.2 – 57.5 = 5.7 m
The difference in elevation between point A and the 58 m contour is:
58.0 – 57.5 = 0.5 m
Hence, the distance of the 58 m contour from point A along AB is:
(0.5 / 5.7) × 2 cm = 1.8 mm
Similarly, the distances for the 60 m and 62 m contours from point A can be calculated:
(2.5 / 5.7) × 2 cm = 8.8 mm
(4.5 / 5.7) × 2 cm = 15.8 mm

(c) Interpolation Along BC
The total elevation difference between points B and C is:
68.2 – 63.2 = 5.0 m
The difference in elevation between point B and the 64 m contour is:
64.0 – 63.2 = 0.8 m
Thus, the distance of the 64 m contour from point B along BC is:
(0.8 / 5.0) × 2 cm = 3.2 mm
The distances for the 66 m and 68 m contours from point C can also be calculated:
(2.8 / 5.0) × 2 cm = 11.2 mm
(4.8 / 5.0) × 2 cm = 19.2 mm
(d) Interpolation Along CD
The elevation difference between points D and C is:
68.2 – 59.2 = 9.0 m
The difference in elevation between point D and the 60 m contour is:
60.0 – 59.2 = 0.8 m
Hence, the distance of the 60 m contour from point D along CD is:
(0.8 / 9.0) × 2 cm = 1.8 mm
The distances for the 62 m, 64 m, 66 m, and 68 m contours from point D can be calculated similarly.
Diagonal Interpolation for Greater Accuracy
To enhance accuracy, interpolation can also be performed along diagonals AC and BD. This additional step ensures that contour lines are drawn more precisely through points of equal elevation.
Preference for Rectangular Grids
In many cases, rectangles with sides in the ratio of 3:4 are favored over squares for interpolation purposes. This is because their diagonals form a 3:4:5 ratio, simplifying calculations. Additionally, the diagonal lengths are often whole numbers, which makes calculations easier when working in full meters.
This method ensures highly accurate contour mapping, though it demands considerable time and effort, making it best suited for projects requiring high precision.
3. Graphical Method of Interpolation
In this method, instead of performing detailed calculations to interpolate contours between known elevation points, the contour locations are determined visually using a graphical approach. This can be achieved with the aid of tracing paper or tracing cloth, and there are two commonly used techniques:
- Drawing parallel lines
- Drawing radiating lines
Drawing Parallel Lines
In this method, parallel lines are drawn on a sheet of tracing paper, with each line representing a constant elevation difference. For simplicity, let the distance between consecutive lines be 2 mm, and every fifth line is drawn thicker to make counting easier.(In figure below)
Example
Suppose we need to interpolate contours at a 2-meter vertical interval between two points:
- Point A: Elevation 112.5 m
- Point B: Elevation 127.5 m
Steps:
- Mark the bottom line on the tracing paper to represent an elevation of 110 m. Each subsequent line represents a 2-meter increase in elevation.
- Place the tracing paper on the map where the points have been plotted. Adjust the position so that the line representing 112.5 m (which falls 0.5 mm between the 112 m and 114 m lines) passes through Point A.
- Rotate the tracing paper around Point A until the line representing 127.5 m (falling 0.5 mm between the 126 m and 128 m lines) passes through Point B.
- At the intersections of the ruled lines and the line joining points A and B, mark the positions for the contour lines.

- The same set of parallel lines can be used to interpolate between other points, as long as the distance between these points is greater than the spacing between the contour lines on the tracing paper.
- If the distance between points is smaller than the perpendicular spacing between contour lines, adjust the spacing by assigning different values to the lines. For example, make each line represent 3 meters instead of 2, with every fifth line representing elevations like 110 m, 125 m, and 140 m.
- After adjusting and aligning the tracing paper to represent the correct elevations, mark the contour points between other elevation points similarly.
Once all the contour points are determined graphically, draw smooth contour lines through the points that share the same elevation. This method, while quicker than arithmetic calculations, provides a visual and intuitive way to interpolate contours.
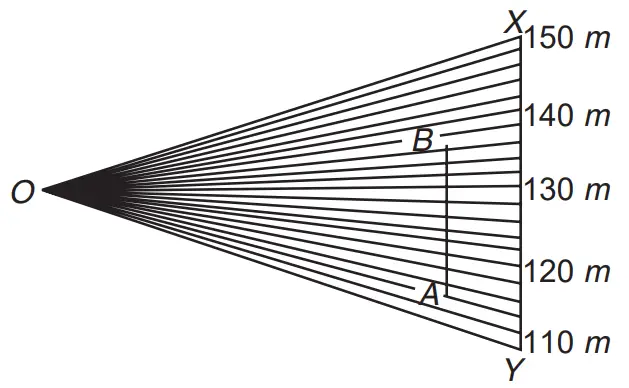
Graphical Interpolation Using Radiating Lines
This method employs radiating lines to interpolate contours between known elevation points. Here’s the process:
Create a Base Line (XY):
- Start by drawing a line XY of any convenient length on a sheet of tracing paper.
- Divide this line into equal parts, say 2 mm intervals.
Construct Radial Lines:
- From the midpoint of line XY, draw a perpendicular line.
- Select a point O on this perpendicular such that the angle YOX is approximately 45°.
- Now, draw radial lines from point O through the division marks on line XY.
Draw Guide Lines:
- Across the radial lines, draw several parallel lines, ensuring they are spaced evenly.
- These parallel lines are referred to as guide lines, and their purpose is to help visualize and interpolate contours.
- To aid in reading the diagram, the first radial line and every fifth radial line should be drawn thicker or bolder.
Example
Let’s say we need to interpolate contours at a 2-meter vertical interval between two points:
- Point A: Elevation 114.5 m
- Point B: Elevation 137.5 m
Steps:
Assign Y on the base line to represent an elevation of 110 m, and every fifth line thereafter to represent 10-meter intervals (i.e., 110 m, 120 m, 130 m, etc.).
Place the tracing paper over the plan, aligning the 114.5 m and 137.5 m radial lines so that they pass through Point A and Point B respectively.
Mark the intersections of radial lines representing elevations of 116, 118, 120, 122, 124, 126, 128, 130, 132, 134, and 136 m with the line connecting Point A and Point B.
Once the intersections are pricked through, you will have the positions of the required contour points on the plan.
After locating the contour points between Point A and Point B, draw smooth contour lines through points of equal elevation. Repeat the process for other points on the plan to complete the contour map.
This method, while more visual, is efficient for interpolation without complex calculations and provides quick and reliable results when performed carefully.


