Table of Contents
ToggleContour
A contour is an imaginary line that connects points of equal elevation on the ground. It serves as a key tool in representing the shape and slope of the land on a two-dimensional map. Essentially, a contour line is the intersection of a level surface with the Earth’s surface. While contours are usually invisible in nature, shorelines are an exception, as they naturally follow contour lines.
Contours are invaluable for depicting features like hills, valleys, and depressions. When these contours are drawn underwater, they are referred to as submarine contours or bathymetric curves. The more closely spaced the contour lines on a map, the steeper the terrain they represent. On the other hand, widely spaced contours indicate gentle slopes.
To better understand the concept of a contour, one can imagine a body of still water, such as a pond. If the water level is at 100 meters, the edge of the water forms a contour line at that elevation. If the water level drops to 95 meters, the new shoreline forms a contour at 95 meters, illustrating how contours work at varying heights.
Contour lines are typically drawn freehand, with breaks for labeling elevations, making it easier to visualize the topography of an area. This method allows for the clear and effective representation of terrain features on maps.
Contour Interval
The contour interval is the vertical distance between two consecutive contour lines on a map. It is typically kept consistent across the map to accurately represent the topography of the terrain. A uniform contour interval helps provide a clear and true depiction of the land’s relief.
In some cases, however, a variable contour interval may be used, though this is generally avoided to prevent misrepresentation of the terrain’s steepness. For instance, in regions with excessive steepness, such as the high mountain ranges in northern India, a larger contour interval might be necessary to account for the drastic elevation changes.
Contour intervals can range from 1 to 15 meters, depending on the nature of the terrain and the level of detail required. A smaller contour interval provides a more detailed and precise depiction of the terrain, while a larger interval may be used for broader, less detailed representation. Maintaining a consistent interval ensures that the map accurately reflects the topography without misleading the viewer.
Factor Affecting Contour Interval
The choice of contour interval depends on several considerations:
1. Scale of the Map:
The contour interval is inversely proportional to the map’s scale. For smaller-scale maps, where the area represented is large, a larger contour interval is necessary to prevent contour lines from merging. Conversely, on large-scale maps, where detail is essential, a smaller contour interval is used. For example, if a small contour interval is used on a small-scale map, the horizontal distance between consecutive contours might be too small, causing them to overlap or converge. For a topographical map, the interval may range as shown below:
| Ground Surface | Large Scale (1 cm = 1 – 10 m) |
Intermediate Scale (1 cm = 10 – 100 m) |
Small Scale (1 cm = 100 m onwards) |
|---|---|---|---|
| Flat | 0.2 – 0.5 m | 0.5 – 1.0 m | 1.0 – 3.0 m |
| Rolling | 0.5 – 1.0 m | 0.5 – 1.5 m | 2.0 – 5.0 m |
| Hilly | 1.0 – 1.5 m | 1.5 – 3.0 m | 5.0 – 15 m |
2. Purpose of the Map:
The intended use of the map greatly influences the contour interval. For large-scale construction projects such as highways, a larger contour interval may suffice. However, for detailed site planning, like designing a university campus, a smaller contour interval is essential to capture finer details of the terrain.
3. Nature of the Ground:
The topography of the area determines the appropriate contour interval. Flat terrain requires smaller contour intervals to accurately depict gentle slopes, while steep or hilly terrain can be represented with larger intervals. In essence, the contour interval is inversely proportional to the flatness of the ground: the steeper the terrain, the larger the contour interval.
4. Availability of Time and Funds:
When time or budget is limited, a larger contour interval may be adopted to speed up the surveying process and reduce costs. Conversely, if sufficient time and resources are available, a smaller contour interval can be selected to ensure greater accuracy.
5. Topography and Project Requirements:
For general topographical maps, the contour interval is often selected using a formula based on the map scale. A common rule of thumb is:
For maps measured in kilometers:
Contour interval (meters) = (20 or 25) / (number of centimeters per kilometer on the map)
The choice between 25 and 20 depends on the specific mapping convention being used. The 25 variant is more common in many countries.
Alternatively, for maps measured in miles:
Contour interval (meters) = 50 / (number of inches per mile on the map)
For different terrain types and project needs, the contour interval varies:
- Highways/Railways: Up to 2 meters
- Earthworks/Building Sites: As small as 0.5 meters
- Geological Surveys: Typically between 6 to 15 meters
- Town Planning: 0.5 to 2 meters depending on scale
For extended surveys and complex terrain, larger intervals are often required to balance accuracy and resource constraints.
Horizontal Equivalent
The horizontal distance between two successive contour lines is known as the horizontal equivalent. This value is not fixed; it varies depending on the slope of the terrain. On steeper terrain, the horizontal equivalent is shorter, while on gentler slopes, it increases. To estimate the horizontal equivalent between two points, you can divide the contour interval by the gradient between those points. For instance, if the contour interval is 1 meter and the gradient is 1 in 20, the horizontal equivalent would be calculated as 1 / (1/20), resulting in 20 meters.
Contour Gradient
A contour gradient is an imaginary line on the Earth’s surface that maintains a constant slope relative to the horizontal plane. This gradient can either be a rising or falling gradient, and it is typically expressed as the ratio of vertical height to horizontal distance. For example, if a canal bed drops by 1 meter over a horizontal distance of 100 meters, the gradient is described as 1 in 100. Similarly, if a railway track rises 1 meter for every 250 meters of horizontal length, the contour gradient would be 1 in 250.
Once the inclination of a contour gradient is known, its direction on the ground can be identified using specific surveying instruments, such as:
- Indian Tangent Clinometer
- Theodolite
- Level
- Ghat Tracer
Grade Contours
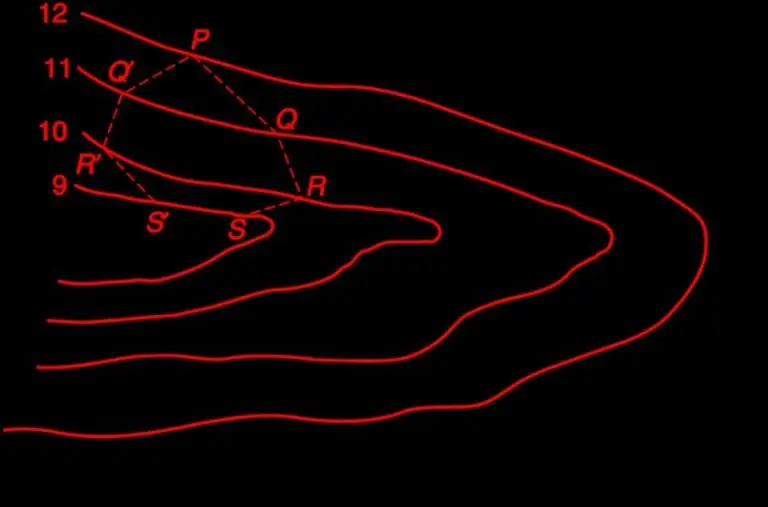
Grade contours represent lines on a map that show where the slope maintains a constant gradient, meaning the steepness of the land remains the same along those lines. These lines are particularly useful when planning roads, railways, or canals, where you want to ensure that the gradient doesn’t exceed a certain limit for safety or functionality.
Imagine you’re designing a road down a hill. The road needs to follow a consistent slope for safety, say 1.5 meters of descent for every 30 meters of horizontal distance (1.5 in 30 gradient). Grade contours help you map out exactly where that road should go to maintain that consistent gradient.
If you start at point P on a map where the elevation is 12 meters, you’d calculate how far horizontally (on the map) you need to travel to reach the next contour line based on the gradient and contour interval. For a 1-meter contour interval and a 1.5 in 30 gradient, you’d move 20 meters horizontally (calculated as 30 ÷ 1.5). for every 1-meter drop in elevation.
Using grade contours ensures the path follows that exact slope, and more than one possible alignment might exist, giving flexibility in design.