Table of Contents
ToggleIntroduction to Map Scales
Definition of Map Scale
A map scale is the fixed proportion that every distance between points on a map bears to the corresponding distances between their positions on the ground. In essence, it’s a ratio between the size of an object or distance on a map and its actual size or distance in the real world.
For example, if 1 cm on a map represents a distance of 5 meters on the ground, the scale of the map is said to be 1 cm = 5 m.
Imagine you’re an engineer tasked with designing a new highway. You can’t simply draw the entire length of the road on a piece of paper without any scaling; it would be impractical and inaccurate. Instead, you use a map scale to represent the real-world distances on a smaller, more manageable scale. This allows you to accurately plan and visualize the project while keeping the proportions and distances consistent with reality. Map scales are crucial for translating large structures and distances into a comprehensible format, ensuring precision and clarity in engineering designs and plans.

Importance of Scale in Mapmaking and Engineering
Map scales are crucial in cartography for several reasons:
- Accuracy: Scales ensure that map users can accurately interpret distances and sizes of features represented on the map.
- Consistency: They provide a standardized way of representing real-world dimensions across different maps.
- Information Density: The choice of scale determines how much detail can be shown on a map of a given size.
- Practical Applications: Scales allow users to perform calculations and measurements for various purposes, such as navigation, urban planning, or geological surveys.
- Communication: They help convey the relationship between the map and the area it represents, essential for proper map reading and interpretation.
Types of Map Scales
Map scales are generally represented in two main forms: numerical scales and graphical scales.
1. Numerical Scales
Numerical scales express the relationship between map and ground distances using numbers. They are further divided into two types:
a) Engineer's Scale
An engineer’s scale represents the relationship where one unit on the map (usually centimeters) equals a whole number of units on the ground (usually meters).
Example: 1 cm = 5 m, 1 cm = 10 m, etc.
This type of scale is intuitive and easy to use for quick estimations.
b) Fraction Scale or Representative Fraction
Also known as the Representative Fraction (R.F.), this scale expresses the ratio between map distance and ground distance using the same unit of measurement.
Example: 1:500, 1:1000, 1:5000, etc.
In the scale 1:500, one unit on the map represents 500 units on the ground, regardless of the unit of measurement used.
Fraction scales are versatile as they remain valid regardless of the unit of measurement, making them useful for international use.
Comparison of Engineer's Scale and Fraction Scale
| Basis of Difference | Engineer's Scale | Fraction (Representative Fraction) Scale |
|---|---|---|
| Definition | A scale where one unit on the map (usually centimeters) equals a whole number of units on the ground (usually meters). | A scale that expresses the ratio between map distance and ground distance using the same unit of measurement. |
| Example | 1 cm = 5 m, 1 cm = 10 m | 1:500, 1:1000, 1:5000 |
| Units | Uses different units for map and ground distances (e.g., cm on map and m on ground). | Uses the same units for both map and ground distances. |
| Ease of Use | Intuitive and easy for quick estimations, especially in engineering and construction. | Versatile and remains accurate regardless of the unit of measurement, useful for detailed mapping. |
| Common Applications | Architectural drawings, blueprints, engineering projects. | Topographic maps, international maps, detailed geographic representations. |
| Measurement Precision | High precision for specific unit conversions (e.g., cm to m). | High precision for proportional representations regardless of units. |
2. Graphical Scales
A graphical scale, also known as a bar scale, is a line drawn on the map subdivided into marked units of distance on the ground.
Key features of graphical scales include:
- Visual representation of distances, making it easy for map users to quickly estimate distances.
- Resistance to distortion: If the map is reproduced at a different size, the graphical scale changes proportionally, maintaining its accuracy.
- Typically drawn to represent convenient units of length on the ground, such as kilometers, miles, or meters.
Graphical scales are particularly useful when maps may be reproduced at different sizes or when quick, approximate measurements are needed.
Importance of Drawing Graphical Scales on Maps
Graphical scales are crucial in cartography due to their ability to counteract the various forms of distortion that maps can undergo. Environmental factors, such as humidity, temperature changes, or physical handling, can cause maps on paper to distort over time. Additionally, reproduction processes like photocopying or digital scanning can alter the map’s size, thereby affecting numerical scales. Paper may not shrink uniformly, leading to inconsistencies and inaccuracies across different parts of the map. Graphical scales address these issues by:
- Proportional Distortion: Graphical scales distort proportionally with the map, maintaining accuracy even if the map size changes.
- Visual Reference: They provide an immediate visual reference for distance estimation.
- Universal Understanding: Graphical scales can be understood regardless of the user’s familiarity with the map’s units of measurement.
- Error Reduction: They reduce the chance of miscalculation when converting between map and real-world distances.
Requirements of a Useful Scale
To ensure that a map scale is effective and user-friendly, it should meet the following requirements:
1. Length
- The scale should be between 18 cm and 32 cm long.
- This range ensures the scale is long enough to be useful but not so long as to be unwieldy.
2. Accuracy
- Divisions and subdivisions must be precisely marked and correctly numbered.
- Accuracy is crucial for reliable measurements and calculations.
3. Readability
- The scale should be easily readable without requiring complex arithmetic.
- Main divisions should represent round numbers (e.g., 1, 10, 100, or 1000 units).
- The zero point should be placed between the whole units and their subdivisions for clarity.
4. Labeling
- The name of the scale and its representative fraction (R.F.) should be clearly written on the map.
- Proper labeling ensures users understand the scale’s relationship to real-world distances.
- Units of measurement should be clearly indicated.
Classification of Scales
In cartography and measurement, several types of scales are used for different purposes. Here’s an overview of the main types:
1. Plain Scales
- Definition: A plain scale is a straight line divided into equal parts, each representing a specific distance on the ground.
- Usage: They are used to measure or represent two dimensions, such as meters and decimeters, or kilometers and hectometers.
- Features:
- Simple to construct and read
- Limited to two levels of measurement (e.g., kilometers and hectometers)
- Commonly found on most maps for quick distance estimation
Steps to Construct Plain Scale
To construct a plain scale with a representative fraction (R.F.) of 1:50,000 for measuring miles and furlongs, follow these steps:
- Determine the Length of the Scale: The scale's R.F. is 1:50,000, meaning 1 unit on the scale represents 50,000 units on the ground. Given that 1 mile equals 1760 yards, the scale length for 1 mile can be calculated as:
- Scale length for 1 mile = (1760 yards × 36 inches × 2.54 cm/inch) / 50,000 ≈ 3.219 cm
- Divide the Length into Main Divisions: The total length of 19.314 cm is divided into 6 equal parts, each representing one mile.
- Subdivide the Leftmost Division: The first division (representing 1 mile) is further subdivided into 8 equal parts, each representing one furlong.
- Place the Zero Point: The zero point is positioned between the undivided (miles) and subdivided (furlongs) parts.
- Mark the Readings: Starting from the zero point, the miles are marked from 0 to 6 on the right side, and the furlongs are marked from 8 to 0 on the left side.
This setup allows users to measure distances accurately using both miles and smaller units (furlongs) for finer measurements. The plain scale is an essential tool for surveying and cartography, providing a straightforward way to translate map distances into real-world measurements.
2. Diagonal Scales
- Definition: A diagonal scale consists of a series of parallel lines intersected by diagonal lines, enabling more precise measurements.
- Usage: They can measure three dimensions, such as kilometers, hectometers, and decameters.
- Features:
- More accurate than plain scales
- Can measure smaller subdivisions
- Useful in surveying and engineering drawings where higher precision is required

Steps to Construct and Use a Diagonal Scale
1. Draw the Main Scale:
- Draw a horizontal line and divide it into equal segments representing the primary units. For example, if you’re measuring kilometers, each segment might represent 1 km.
- Label these segments with numbers starting from 0.
2. Create Subdivisions:
- Divide the first segment (from 0 to 1) into smaller equal parts, each representing a subunit. For instance, if the main unit is kilometers, you might subdivide into 10 parts, each representing 100 meters.
3. Add Vertical Lines:
- At the end of each subunit division, draw a vertical line upward.
4. Draw the Diagonal Lines:
- From the top of the first vertical line (representing the first subunit), draw a diagonal line to the bottom of the next subunit division. Repeat this for each subdivision, creating a series of diagonals that connect the ends of each vertical line.
5. How to Read the Diagonal Scale:
- To measure a distance, first find the number of full primary units using the horizontal scale. Then, use the vertical divisions and diagonal lines to determine the additional fractional measurement.
- For example, if measuring 2.35 km, locate the “2” on the main scale. Then find the 3rd vertical line and move diagonally up to the 5th diagonal line to read the fractional part.
3. Scale of Chords
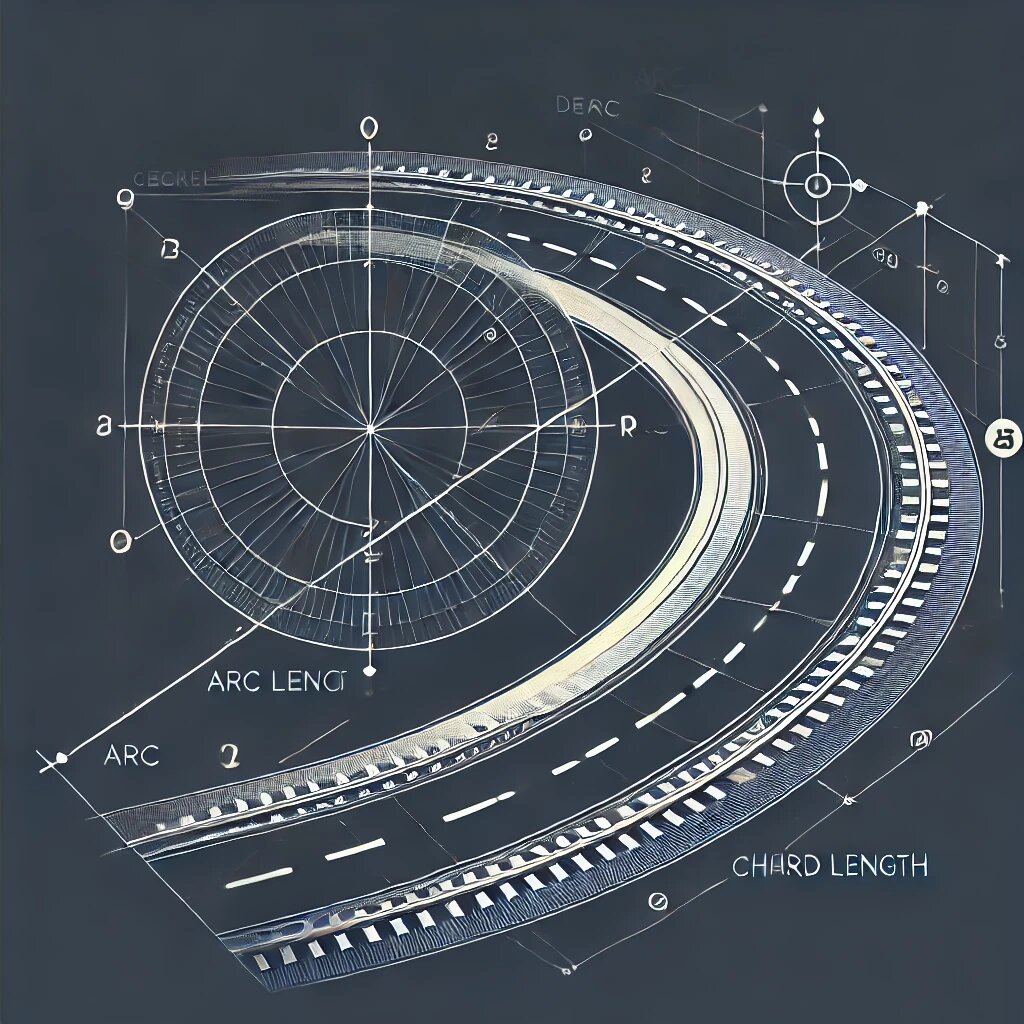
The scale of chords is used primarily for measuring or setting off angles.
- Definition: A scale of chords is a specialized scale used to measure angles or to set off angles on drawings.
- Usage: Commonly used in navigation, astronomy, and some specialized mapping applications.
- Features:
- Based on trigonometric principles
- Often found on specialized drafting tools or protractors
- Allows for precise angle measurements without using a protractor
4.Vernier Scale
Vernier scales are auxiliary scales used to increase the precision of measurements on the main scale.
- Definition: A vernier scale is a short, movable scale that slides along the main scale to provide finer measurements.
- Usage: Used in various precision measuring instruments, including some specialized mapping tools.
- Types:
- Single Vernier: Graduations in one direction only
- Double Vernier: Graduations in both directions
- Direct Vernier: Smallest division is shorter than the main scale division
- Retrograde Vernier: Smallest division is longer than the main scale division
- Features:
- Significantly increases the precision of measurements
- Can measure fractions of the smallest division on the main scale
- Requires some practice to read accurately